Integrated Project 1 (IP1)
CASA continued to validate and advance the DCAS concept during 2008 through the operation of the Integrated Project One (IP1) Systems Test Bed located in southwestern Oklahoma, see Figure 34. To achieve this goal, two intensive field operations were conducted during 2008: the CASA Spring Experiment-2008 (CSET-08) from April 7 – June 6, 2008 and the CASA Autumn Experiment-2008 (CAET-08) from September 27 – October 17, 2008. The overarching goal of these experiments was to demonstrate the value-added by a DCAS system relative to the state-of-the-art (sit and spin, long-range, open-loop, “data push”, non-networked radars) and the potential impact on current severe weather warning processes. In contrast to typical radar field experiments which focus on collecting raw data and archiving it for subsequent post processing and analysis by researchers, the CASA field experiments are executed as a real time end-to-end system operation, disseminating data to users for operational evaluation and ingest into forecast models while simultaneously archiving data for more thorough scientific investigation. To be able to execute the experiment in this real time end-to-end mode, the following was put into place:
-
An executive team that consists of a member of each of the thrusts (B. Philips, V. Chandrasekar, J. Brotzge, M. Zink) under the lead of V.Chandrasekar who manages the overall experiment.
-
Besides the executive team, the overall IP1 experiment team consists of several members from all thrusts.
-
For each experiment a Scientific Overview document is created that specifies the research goals of the experiment. (Available to all CASA members via QuickPlace.)
-
For each experiment an Operations Plan is created that serves as a handbook for the team members to support them in the daily operations process. (Available to all CASA members via QuickPlace.)
-
Beginning with the Spring 2009 season, a Translation Plan and a Sustainment Plan will also be created.
-
Each experiment is preceded by a preparation phase at which the system and new functionalities of the system are thoroughly tested.
- During the experiment daily meeting are held to coordinate operations and address any issues that might have occurred earlier. All members of the spring experiment team attend these meetings.
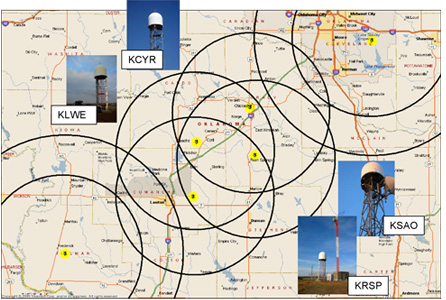
Figure 34. IP1 Test Bed. Radar sites are located in or near the cities of Chickasha (KSAO), Rush Springs (KRSP), Lawton (KLWE), and Cyril (KCYR). Range rings of 40 km are shown. The nearest NEXRAD sites located near test bed are the radars at Twin Lakes (KTLX) and Fredrick (KFDR) and are shown with 40 km and 60 km range rings.
Spring Experiment 2008
During this experiment 17 interesting weather cases were collected in the testbed. Information about each of these events is available on the IP1 SOCC web page (http://socc.caps.ou.edu). These events mainly observed severe storms but also included high wind events and hail. In all of these events components of the testbed were carefully analyzed by the experiment team members. Live data was also made available to NWS forecasters and emergency managers. In some cases the analysis of the system behavior identified shortcomings in the system or in some of its components. In these cases, changes were performed, after careful consideration with all thrusts, with the intent to improve the overall system behavior.
Fall 2008
The official CASA Fall Data Collection period extended from Sep 22 to Oct 17, 2008. However, in order to capture several additional events, the radars were operated through mid-November. Eight convective events were collected during the fall, two of which contained severe weather and several more that captured intersecting boundaries and convective initiation. On October 6, a classic convective line moved east across the network yielding four severe hail reports within the testbed. Seven hours later an area of "clear-slot convection" initiated within the multi-Doppler area of IP1, yielding strong (but not severe) isolated storms. On October 13, a strong outflow boundary was overtaken by a strong cold front within IP1, initiating lines of storms in the testbed. On November 5-6, a strong cold front moved across the testbed, initiating an area of isolated storms and producing a swath of severe weather across the testbed including 3 severe wind reports and 8 severe hail reports. In total, convection was recorded in the network for approximately 75 hours, during which time all four radars were operating continuously.
New operational features
In the following, new features that were integrated into the testbed for the 2008 experiments are listed. It is important to mention that in all these cases two or more thrusts had to collaborate to get these features integrated into the testbed and into a stable, operational level. Where applicable references to the projects that perform the core research for these features will be given.
Range-Height-Indicator (RHI) Scans
Prior to the 2008 Spring Experiment, both surveillance and sector scans were PPI based scans. RHI scans are an alternative to quickly obtain information about the vertical structure of a storm. Prior to the 2008 Spring Experiment we implemented a mechanism into the MC&C that lets the IP1 system perform automated RHI scansas follows. To determine the azimuthal position of the RHI, the highest reflectivity area of the storm in the coverage area of the radar is determined. At this position an RHI will then be performed in elevation from 0º to 30º degrees. The 30º maximum is a hardware-based limit, which we might change in the future based on a new design that has already been implemented and tested on the MA1 radar on the UMass campus. RHI scans are performed every 3 minutes (or in other words every 3rd heartbeat). In the heartbeat in which the RHI scan is performed, it is interleaved with either surveillance or sector scans based on the scanning determined by the MC&C. Figure 35 shows the scans initiated by the MC&C on top of the reflectivity data of the actual storm. The small wedges leading from the radar centers all the way out to the maximum range, indicate the azimuthal position of the RHI scan. In the case shown in
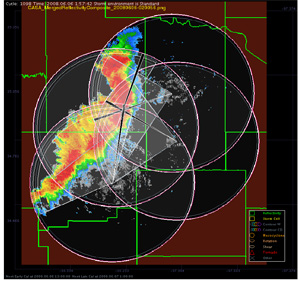
Figure35, the most intense part of the storm is located in an area where all four radars overlap. Thus, the RHI scans from all four radars are intersected which results in multiple cross section views of this intense part of the storm.
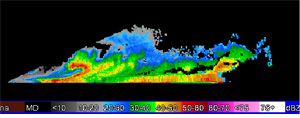
Figure 36 shows the resulting reflectivity data for the RHI scan performed by the IP1 radar in Chickasha.
This new scanning method resulted from close collaboration between all thrusts. First of all, the interface between the MC&C and the radar controller had to be modified to allow scanning commands that initiate and RHI scan (Sensing, Distributing). All thrusts collaborate in determining on which part of the storm the RHI scans should be performed. Finally, the Predicting and End User thrusts collaborated on how the data from these scans is going to be displayed to the end users.
Clear-Air/Storm Mode
To increase the sensitivity of the system in clear air and to obtain refractivity data, we decided to scan the radars in a different mode than the one used during precipitation. In clear air mode the radar performs two 360º scans during a 60 second heartbeat. The first one is at 1º in elevation with a 16º/s azimuthal speed and the clutter filter turned off for refractivity data collection (see project report LA2). The second scan is performed at 2º elevation with an azimuthal speed of 12º/s with the clutter filter turned on. In this second case the clutter filter algorithm has to be turned back on to assure that the detection algorithms do not create any false alarm by reporting detections based on echos from clutter.
The switching between the clear air and the storm mode is performed automatically by signaling the appropriate scanning mode from the MC&C to the radars. There are two main decisions that have to be made by the MC&C to switch back and forth between the two scanning modes. After meteorological activity in the testbed has ended, the MC&C has to decide when to switch from Storm into Clear-air mode. On the other hand, when weather moves into the testbed, the MC&C has to detect meteorological activity and switch from Clear-air to Storm mode. The MC&C switches from Storm to Clear-air mode if it detects an absence of features for a particular amount of time. The operational MC&C is setup in a way that the switch will happen if detections are absent for 20 minutes. The switch from Clear to Storm mode will be performed as soon as the detection algorithms report detections to the feature board. This feature has been operational throughout the Spring Experiment 2008. An additional option that we have provided for, but do not use at the moment, is the use of NEXRAD data to determine the switch between Clear-air and Storm mode. This option allows the preemptive switch of the system before any weather actually moves into our testbed. So far, switching based on data from the IP1 radars is fast enough which prevents us from using the NEXRAD-based option.
Also, in this case, a change in the interface between the MC&C and the radar controller required collaboration between the Sensing and Distributing thrusts to allow the automatic activation and deactivation of the clutter filter algorithm.
Nowcasting
The first operations with a prototype of the nowcasting algorithm took place in the Fall Experiment 2008. In this specific case, the occasion of the Fall Experiment was used to start the integration of the nowcasting algorithm into the testbed. Data was not made available to the operational end user community but was evaluated internally by experiment team members. Recently, for the first time ever, the detection algorithms were run on the 5-minute nowcast data and these detections were reported to the MC&C. These future tasks (based on the nowcast detections) are, in addition to present tasks (based on real-time detections), taken into consideration by the optimization to determine how the radars will be scanned in the next heartbeat. This was the first time the system’s control loop has been closed on nowcasting data.
Members of the Analysis and Predicting thrust developed the nowcasting algorithm itself but making it operational in the testbed has been a true interdisciplinary effort between members from all thrusts. This effort is also in preparation for a later project that increases the forecast time out to 1-2 hours or longer using NWP. The multi-thrust collaboration achieved during the nowcast integration will better position the researchers to make progress on the NWP problem. Integration of the nowcasting algorithm is also a first important step towards future activities planned for the IP5 tested. These include the demonstration of very short range forecasts to emergency managers and optimal spotter deployment.
Dual-Doppler Retrieval
Members from the Sensing and Distributing thrusts have collaborated on implementing an automated MC&C issued dual-Doppler scanning mechanism. This mechanism is fairly complex since several constraints have to be taken into account to scan the radars optimally for dual-Doppler retrieval. First of all, there is the constraint that the beam crossing angle between the beams of two radars is greater than 30º. This requirement insures that wind vectors can be retrieved with satisfactory error variances. The following method is applied do determine the pair of radars that performs the dual-Doppler scanning. Since both radars will perform a sector scan, the minimum beam crossing angle of all possible beam crossings will be determined. If the minimum is not greater than 30º, a utility of 0 is assigned to this configuration as this means that the dual-Doppler condition cannot be satisfied for all points in the task. Otherwise, a utility greater than 0 will be assigned to the task and this pair of radars will perform the dual-Doppler scan. Second, the radars must also complete the scans of the task with some level of temporal synchronization. Synchronization of beams is handled by constraining the elevations chosen for a pairs of radars. The level of synchronization needed is on the order of tens of seconds, which makes this simple technique work due to the scanning commands starting at roughly the same time at each radar. The final consideration for dual-Doppler scanning is the vertical spacing of the beams at their furthest extent. This is referred to as the back wall spacing. Specifying a list of tilt angles designed to maintain proper spacing at a given range satisfies the back wall spacing problem.
The MC&C running in the IP1 system is instrumented to collect data to verify that dual-Doppler scanning commands are being issued that meet all the necessary constraints. Figure 25 shows time synchronization, beam crossing angles and back wall spacing for a series of radar pairs for a small part of a recent weather event observed by the IP1 system. The MC&C has specific dual-doppler rules that are triggered when certain features are detected and input into the task generation. Each column represents a dual-Doppler scan during a single heartbeat, that is, between a pair of radars scanning a task. Some tasks are scanned by more than two radars in which case there will be multiple columns for that task corresponding to each pair of radars.
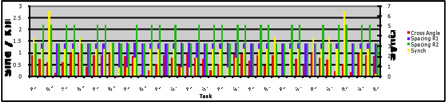
Figure 37. Analysis of MC&C initiated dual-Doppler scans
Detection Algorithms
In discussions with National Weather Service forecasters and others, it became apparent that for improved data presentation quality, scanning to the very leading edges of storms is preferred over focusing specifically on the areas of highest intensity. Since both of the reflectivity-based algorithms used in the closed-loop are versions of local-maxima finders and are not intended to fully describe the irregular geometries of weather, we decided to introduce data contouring into the closed-loop. Contouring provides precise geographical description of the location of relevant weather to the MC&C, and the closed-form nature of a contour facilitates the difficult problem of objectifying data out of fields, or more specifically, identifying a 'storm' and maintaining that association over time as the structure evolves. The contour points represent a layer in between the raw field level and the pure object level; less voluminous and more user-centric than moment data, but still retaining enough spatial information to provide accurate description, which higher level abstractions lack. The contour algorithm was officially brought online in mid-2008 as a collaborative effort between the End User, Analysis and Predicting, and Distributing thrusts. The components involved in the contouring closed loop process have been extensively tested since inception and are quite stable.
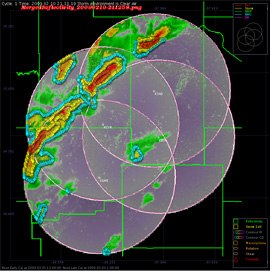
Figure 38. Contour detections based on merged reflectivity data
Real-time Analysis
To address a need raised by end-users, real-time wind analysis mapping was completed and tested during the spring storm season of 2008. The wind analysis is computed using a three-dimensional variational technique and includes CASA and NEXRAD radar data, surface in situ data, and background model field to provide end-users with the most accurate wind estimates possible. Collaborative research with the End-user thrust examined the effectiveness of the wind analysis product to operational forecasters in the Hazardous Weather Testbed (HWT) during spring 2008. Feedback from this process has been used to improve the analysis, and the analysis will be tested again in the HWT during spring 2009.
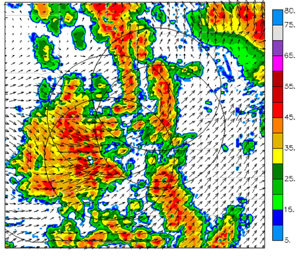 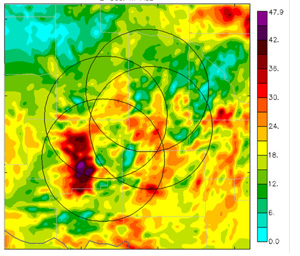
Figure 39: Composite reflectivity (left) and winds (right; kts) at 500 m AGL. The winds were estimated using 3DVar and available to end-users in the Hazardous Weather Testbed in real-time during spring 2008. Composite was updated every 3 minutes.
Refractivity
In an associated activity to CASA, an NSF-sponsored project led by the University of Oklahoma aims to produce real-time differential refractivity retrieval (DRR) using data from the IP1 testbed. This has precipitated long-term and detailed discussions with the Sensing Thrust to enable accurate refractivity retrieval. Additional variables were introduced into the data stream to permit refractivity retrieval, which required input and help from all thrusts to implement such a significant change to the system. For example, the introduction of the refractivity retrieval required the implementation of the automatic switch between Clear-air and Storm mode, as described above. Once operational, the refractivity products will be displayed within the HWT. Then research will begin with the End-user Thrust to better understand how best to display refractivity to end-users as well as to understand how these products can best be used in an operational environment to improve forecasts and warnings.
Real-time Numerical Weather Prediction
A significant component of the Prediction Thrust is the development of real-time forecasts using the CASA data. These forecasts are to be used by both the real-time system to improve adaptive scanning as well as by end-users to extend warning lead-time and ultimately end-user response. As with all other products, the development, implementation and testing of NWP requires the involvement of all thrusts.
Six-hour forecasts are generated each time storms enter the IP1 network. Each model is run at a resolution of 1-km and assimilates CASA and NEXRAD radar data, satellite data, in situ surface data, and model background information. Detailed meetings with the Sensing Thrust have improved the quality of CASA data, critical for proper data assimilation, and additional flags have been incorporated into the data streams to accommodate the model developers. In collaboration with the End-user Thrust, forecast output will be presented to forecasters in the HWT during spring 2009 to determine how best to present this data for use in real-time and how best to use this information to extend lead-time and improve public warning response.
Hazardous Weather Test Bed
CASA participated for a second year in the NOAA’s Hazardous Weather Test bed (HWT) between April 27 and June 8, 2008. This program seeks to link operational forecasting/warning and current research by bringing in NWS forecasters and scientists from around the county for a week-long stay at the HWT. In 2008, 24 forecasters observed and evaluated CASA data. The goal was to identify unique weather features and capabilities observed in CASA that provide information for weather assessment, especially compared to NEXRAD. Forecasters engaged in two principal activities: i) Case analysis where forecasters advanced manually through archived cases, scan-by-scan, discussing their analysis of weather features, comparison of CASA to NEXRAD data and current conceptual models for severe weather. ii) Real-Time evaluation of CASA data. When events occurred in the test bed, forecasters reviewed real time data and evaluated how it might add to the current warning process. In the real time cases, forecasters have to evaluate data with the rapid one-minute update, navigate among the scan elevations, and consult other sources of data. CASA and NEXRAD data was displayed on two WDDS-II stations, AWIPs stations provided environmental information, and situational awareness screens displayed media reports. Forecasters received training on CASA data at the beginning of each session through a presentation and evaluation of a trial case. Participants completed questionnaires during and after case evaluation and their analysis of cases and real time events were recorded.
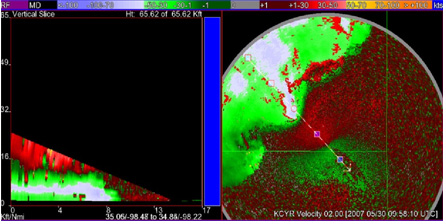
Figure 40. CASA data showing the leading edge of a squall line. The vertical view of the data on the left shows a rear inflow jet and down burst with 70 mph winds (white area). On the right, is a horizontal view of the same feature.
A quiet storm season in the test bed presented few opportunities for real time analysis; however, the archived case review uncovered several advantages of CASA data for evaluating quasi linear convective systems, long lines of thunder storms, that can produce damaging straight line winds and tornados. Forecasters identified MARC signatures, downbursts, and rear inflow jets, and areas of 70 mile per hour low-level winds that could not be viewed on NEXRAD data. CASA’s low-level coverage provides an advantage for squall lines as the most damaging event occur and originate at low levels. In addition, this network of small over lapping radars provides more complete data on winds. Forecasters reported that CASA confirms conceptual models for storm development by providing details through high resolution, lower troposphere data lacking in NEXRAD data.
|