Range Height Indicator (RHI) scans
Prior to the 2008 Spring Experiment, both surveillance and sector scans were PPI based scans. RHI scans are an alternative to quickly obtain information about the vertical structure of a storm. Therefore, we implemented a mechanism into the MC&C that lets the IP1 system perform automated RHI scans, which operates as described in the following. To determine the azimuthal position of the RHI, the highest reflectivity area of the storm in the coverage area of the radar is determined. At this position an RHI scan will then be performed in elevation from 0° to 30° degrees. RHI scans are performed every 3 minutes. In the heartbeat in which the RHI scan is performed, it is interleaved with either surveillance or sector scans based on the scanning determined by the MC&C.
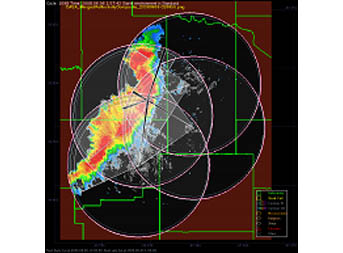
MC&C display indicating RHI scans
Shown at right are the scans initiated by the MC&C on top of the reflectivity data of the actual storm. The small wedges leading from the radar centers all the way out to the maximum range, indicate the azimuthal position of the RHI scan.
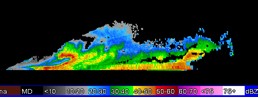
In the case shown, the most intense part of the storm is located in an area where all four radars overlap. Thus, the RHI scans from all four radars are intersected which gives us multiple cross section views of this intense part of the storm. Below is shown the resulting reflectivity data for the RHI scan performed by the IP1 radar in Chickasha.
The CASA IP1 network is the first radar network that performs these automated RHI scans, which provides end users of the system with a new feature to allow them to quickly obtain information about the vertical structure of the storm. This new functionality could be implemented rather quickly since CASA has created a well-established, inter-disciplinary team of researchers and engineers. In addition, it has been shown that the control architecture (MC&C) of the IP1 test bed, which has been designed and implemented by this multi-disciplinary team, is flexible and easy to extend.
|